Forest Inventory and Analysis Database
| Taxonomic Group | Woody Plants |
| Level of Organization | Population |
| Scale | Continental |
| Data Type | Observational |
| Time series | No |
The FIADB contains community information for sites throughout forested lands of the US and its territories. There are three stages of sampling, which affects the type of data available for any given site:
- Phase 1 consists of remote sensing for stratification and identification of forested land.
- Phase 2 [Forest Inventory Plots] consists of one field sample site - designed to cover a 1-acre sample area - for every 6,000 acres of forest, where field crews collect data on forest type, site attributes, tree species, tree size, and overall tree condition - these sites have spatially explicit tree compositional data.
- Phase 3 [Forest Health Plots] consists of a subset of Phase 2 sample plots which are measured for a broader suite of forest health attributes including tree crown conditions, lichen community composition, understory vegetation, down woody debris, and soil attributes. Soil samples are sent to a laboratory for chemical analysis. Finally, an associated sample scheme exists to detect cases of ozone damage occurring to adjacent forest vegetation. Approximately one out of every 17 P2 plots are identified also as P3 plots (or roughly one P3 plot every 100,000 acres).
See the FIA website for more detailed information: http://fia.fs.fed.us/
Location: USA (including AK but excluding HI) and territories (Puerto Rico + US Virgin Islands). The FIADB includes coordinates for every plot location in the database, whether it is forested or not, but these are not the precise locations of the plot centers - “fuzzing and swapping” (Lister et al. 2005 - pdf link) methods are used due to privacy/security issues. Additional descriptions on how the spatial coordinates are masked are provided at this link.
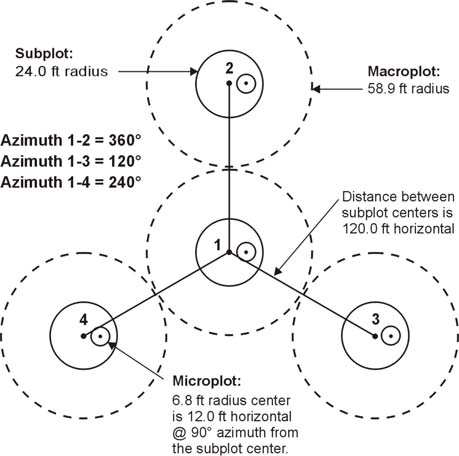
Spatial Scale of data: Each P2 plot is designed to cover a 1-acre sample, typically using four 24.0-foot radius subplots (approximately 0.0415 or 1/24 acre).
Timespan: Although the FIA began in 1929, data are only available electronically for some sites as early as 1970. Data have only been collected periodically at any given site (see Appendix I of Phase 2 manual for exact years of available data per state). Repeat intervals for inventorying individual states varied widely for much of the FIA’s history. However, starting in 1999, states were phased into the annual inventory system (see Appendix I of the Phase 2 manual for the year in which an annual inventory was initiated in each state). As of Feb 2010, annual inventory has not yet been started in Nevada, Wyoming, and Interior Alaska. Although the 1998 Farm Bill specified that 20 percent of the plots within each State would be visited annually, funding limitations have resulted in the actual portion of plots measured annually ranging between 10 and 20 percent, depending on the State. Eastern plots are censused every 5-7 years; western every 10 years. Recent inventories (1999-present) use a nationally standard, fixed-radius plot layout for sample tree selection (fig. 2). Various arrangements of fixed-radius and variable-radius (prism) subplots were used to select sample trees in older inventories (see Data Collection Summary and Issues below).
Frequency: variable repeat intervals – typically every 5-15 years
Observational/Experimental: Observational
Dataset Location: available online at http://fia.fs.fed.us/tools-data/default.asp, follow the format described in this document. Also available at this site are tools to make population estimates. There are the web-based EVALIDator tool or the Forest Inventory Data Online (FIDO) tool, which provide interactive access to the FIADB. Warning: this database is massive – for example, there are 19 data tables (some with >100 fields) and 11 reference tables in the phase 1 and phase 2 portions of the FIA Database alone. There is a ‘Lite’ version of the database that can be used to generate estimates of forest land area and tree biomass, volume, growth, removals, and mortality if associated sampling errors are not needed. However, the Lite version use four tables that are the same as in the full version (POP_EVAL_GRP, COND, TREE, and SEEDLING) and one new table, PLOTSNAP, that is essentialy an amalgamation of 3 tables from the full version. Even if using the Lite version, it is recommended that the user downloads the full zipped folder for each state.
Data collection summary: For the standardized sampling methodology used only since 1999 (PLOT.DESIGNCD = 1), the authoritative source is the Forest Inventory and Analysis National Core Field Guide (see http://www.fia.fs.fed.us/library/field-guides-methods-proc/) . The MANUAL attribute in the PLOT table documents the version number where data collection protocols can be found.
The standard P2 plot consists of four 24.0-foot radius subplots (approximately 0.0415 or 1/24 acre), on which trees 5.0 inches and greater in diameter are measured. Within each of these subplots is nested a 6.8-foot radius microplot (approximately 1/300th acre), on which trees smaller than 5.0 inches in diameter are measured. A core-optional variant of the standard design includes four “macroplots”, each with radius of 58.9 feet (approximately 1/4 acre) that originate at the centers of the 24.0-foot radius subplots. Breakpoint diameters between the 4-foot radius subplots and the macroplots vary and are specified in macroplot breakpoint diameter attribute (PLOT.MACRO_BREAKPOINT_DIA).
Data Collected: Species, diameter, and location for each tree on Phase 2 subplots (at least since 1999) – more data on height, condition, & crown attributes, as well as disturbance histories & surrounding habitat, are available for some sites. Data on biomass and carbon content are calculated and included in the FIADB, and the FIA has developed techniques for population estimation based on included data. Measures of DBH, tree grade, sawlog length, bole length, total length, and the various cull variables are used to calculate tree volume and biomass. “Cull” is the portion of tree that is considered unusable for commercial wood products because of rot, form (e.g., crookedness), or other defect. DBH is also used to calculate the trees basal area (BA). BA is the cross-sectional area of a tree at 4.5 feet above the ground. The results are usually presented as the BA per acre of land. BA is indicative of the stand density and volume; high basal areas indicate large numbers of trees or large volumes or biomass per acre.
Phase 3 Data:
- P3 measures are collected during the growing season (June, July, and August)
- nine variables comprise the crown symptoms measurements
- Soils Data: pH (a measure of acidity); total organic carbon; total nitrogen; exchangeable calcium, magnesium, potassium, and aluminum; and available phosphorus. The litter layer is analyzed for total carbon, organic carbon, and nitrogen. Also included are variables describing soil compaction and erosion.
- Two other P3 data elements are currently being implemented – lichens diversity and ozone bio-indicator plants. Ozone bio-indicator plants are sampled on suitable areas within a 3-mile radius surrounding the plot. For lichen diversity, the field crews search within a circular area with a radius of 120 feet of PC – plot center. The crews look for different lichen species on boles and downed limbs and collect a representative specimen to send to a certified lichenologist for identification at the species level. The crews also note the relative abundance of each specimen. These data are used to describe overall lichen species composition. Ozone sites need to be at least 1 acre in size, must include individual species that are known to be sensitive to ozone, and must be open to the air. between late-July through mid-August and evaluate the sensitive plants for the presence and severity of ozone injury. Ozone injury generally requires both the presence of ozone as well as the proper weather conditions. Ozone injury symptoms are expressed as stippling, flecking, bleaching, and necrosis. Stippling is the most common symptom and is defined as dark pigmentation, commonly purple, of leaf surfaces.
Documentation:
- http://fia.fs.fed.us/library/database-documentation
- This page was prepared using the FIA Database Description and Users Manual for Phase 2, version 4.0, revision 3 (http://fia.fs.fed.us/library/database-documentation/current/ver4/draft%20FIADB_user%20manual_v4-0_p2_03_11_2010.pdf)
- http://fia.fs.fed.us/library/demo-plot-handouts/
- Phase 3 DB manual: http://www.fs.fed.us/nrs/pubs/gtr/gtr_nrs61.pdf
Tips for querying the database:
- SURVEY.ANN_INVENTORY = “Y” - selects only those surveys done using the modern, standardized methodology
- PLOT.PLOT_STATUS_CD = 1: Sampled - at least one accessible forest land condition present
- PLOT.KINDCD > 0 AND < 4: Standard National Design plots - basically NOT 0 (Periodic inventory plot - pre 1990s, non standardized) AND NOT 4 (Modeled periodic inventory plot - conducted only in Northeat and North central regions)
- PLOT.DESIGNCD = 1 or 220 or 240 or 311 - 314 or 328 or 502-505 - all basically sampled the same way (see Appendix B of Phase 2 documentation for explanations)
- PLOT.QA_STATUS = 1: Standard production plot
- PLOT.MANUAL >= 1: limits data to those collected using the standardized methodology described in the National FIA Field Guide
- PLOT.SAMP_METHOD_CD = 1: Field visited (as opposed to 2 = remote sensed)
- PLOT.INVR < 9999 (INVYR is set to 9999 to distinguish those Western Phase 3 plots that are “off subpanel”. This is due to differences in measurement intervals between Phase 3 (measurement interval=5 years) and Phase 2 (measurement interval=10 years) plots. Only users interested in performing certain Phase 3 data analyses should access plots with this anomalous value in INVYR.)
- COND.TRTCD1, TRTCD2, and TRTCD3 = 00: No observable treatment (i.e., no cutting, girdling, herbicides, etc.), but most records are actually NULL in these fields
- COND.STDORGCD - Stand origin code - 0 = Natural stand (vs. 1 = clear evidence of artificial regeneration)
- TREE.STATUSCD = 1 - live trees
- PLOT.STATECD, UNITCD, COUNTYCD, and PLOT should be used in concert to uniquely identify a plot, but the documentation confusingly states that “Along with STATECD, INVYR, UNITCD, COUNTYCD and/or some other combinations of variables, PLOT may be used to uniquely identify a plot.”
Issues:
- A wide variety of plot designs and regionally defined attributes were used in periodic inventories (pre-1999), often differing by State (see Appendix B of Phase 2 manual for description of plot designs). Because of this, some data attributes may not be populated or certain data may have been collected or computed differently. To account for the total area of a State, “place holder” plots were created to represent these nonsampled areas, which are identified by design code 999 in FIADB (PLOT.DESIGNCD = 999). For these plots, many attributes that are normally populated for forested plots will be blank.
- “Users who wish to analyze data using aggregations of multiple State inventories or multiple inventories within States should become familiar with changes in methodology and attribute definitions”
- there are situations where attributes with the same name are defined differently in each table.
- Although trees may exist in a non-forest condition, such trees are not sampled within the FIA program. FIA is a forest inventory and monitoring program, not a tree monitoring program; as such, FIA collects data on trees only within forested conditions. (condition class #1 – accessible forest)
- Seedling data collection - When PLOT.MANUAL < 2.0, the national core procedure was to record the actual seedling count up to six seedlings and then record 6+ if at least six seedlings were present. However, the following regions collected the actual seedling count when PLOT.MANUAL < 2.0: Rocky Mountain Research Station (RMRS) and North Central Research Station (NCRS). If PLOT.MANUAL < 2.0 and TREECOUNT is blank (null), then a value of 6 in TREECOUNT_CALC represents 6 or more seedlings. In the past, seedlings were often tallied in FIA inventories only to the extent necessary to determine if some minimum number were present, which means that seedlings were often under-reported. Note: The SEEDLING record may not exist for some periodic inventories.
- DBH is always recorded as 001 for seedlings.
Comments
These comments are archived from the original Ecological Data Wiki. They are preserved for reference; new comments can no longer be added.
Awesome use of images on a dataset page! I think this really helps convey the information quickly. Thanks Kate.
Very interesting. Thanks for running this down. Would you mind adding some of this information to the main page?